The normal distribution is widely used in understanding distributions of factors in the population. Because the normal distribution approximates many natural phenomena so well, it has developed into a standard of reference for many probability problems.

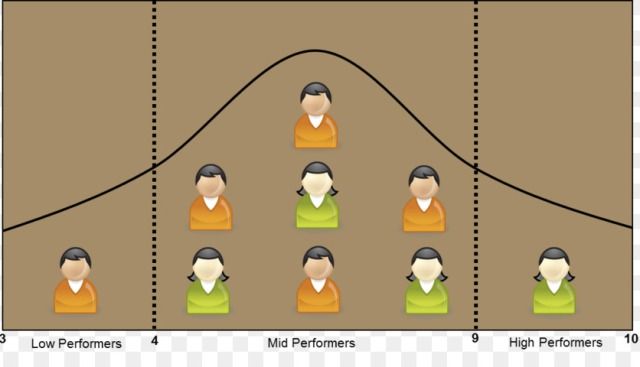
Normal/Gaussian Distribution is a bell-shaped graph that encompasses two basic terms- mean and standard deviation. It is a symmetrical arrangement of a data set in which most values cluster in the mean and the rest taper off symmetrically towards either extreme. Numerous genetic and environmental factors influence the trait.

Central Limit Theorem

Normal distribution follows the central limit theory which states that various independent factors influence a particular trait. When these all independent factors contribute to a phenomenon, their normalized sum tends to result in a Gaussian distribution.
Normal Curve
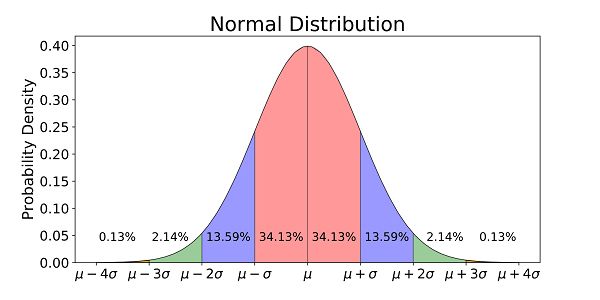
The mean of the distribution determines the location of the center of the graph, the standard deviation determines the height and width of the graph and the total area under the normal curve is equal to 1.
Let’s understand the daily life examples of Normal Distribution.
1. Height
The height of people is an example of normal distribution. Most of the people in a specific population are of average height. The number of people taller and shorter than the average height people is almost equal, and a very small number of people are either extremely tall or extremely short. Several genetic and environmental factors influence height. Therefore, it follows the normal distribution.
2. Rolling A Dice

A fair rolling of dice is also a good example of normal distribution. In an experiment, it has been found that when a dice is rolled 100 times, chances to get ‘1’ are 15-18% and if we roll the dice 1000 times, the chances to get ‘1’ is, again, the same, which averages to 16.7% (1/6). If we roll two dice simultaneously, there are 36 possible combinations. The probability of rolling ‘1’ (with six possible combinations) again averages to around 16.7%, i.e., (6/36). More the number of dice more elaborate will be the normal distribution graph.
3. Tossing A Coin
Flipping a coin is one of the oldest methods for settling disputes. We all have flipped a coin before a match or game. The perceived fairness in flipping a coin lies in the fact that it has equal chances to come up with either result. The chances of getting a head are 1/2, and the same is for tails. When we add both, it equals one. If we toss coins multiple times, the sum of the probability of getting heads and tails will always remain 1.
4. IQ
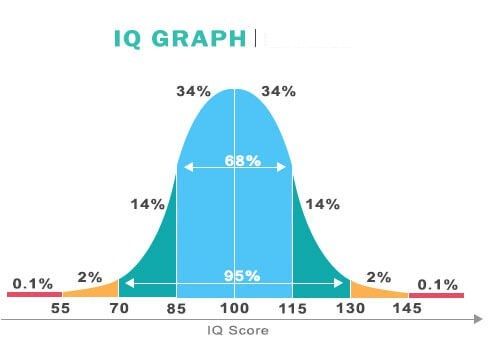
In this scenario of increasing competition, most parents, as well as children, want to analyze the Intelligent Quotient level. Well, the IQ of a particular population is a normal distribution curve; where the IQ of a majority of the people in the population lies in the normal range whereas the IQ of the rest of the population lives in the deviated range.
5. Technical Stock Market
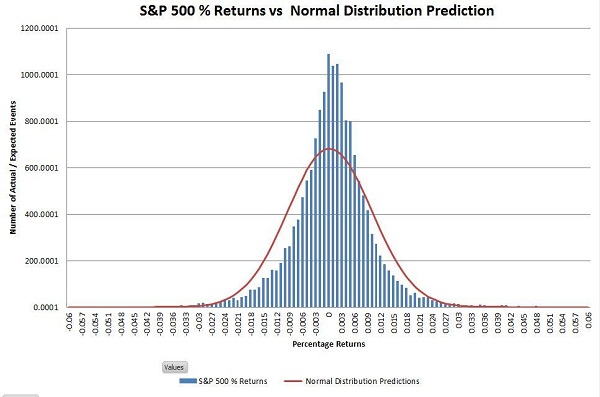
Most of us have heard about the rise and fall in the prices of shares in the stock market. These changes in the log values of Forex rates, price indices, and stock prices return often form a bell-shaped curve. For stock returns, the standard deviation is often called volatility. If returns are normally distributed, more than 99 percent of the returns are expected to fall within the deviations of the mean value. Such characteristics of the bell-shaped normal distribution allow analysts and investors to make statistical inferences about the expected return and risk of stocks.
6. Blood Pressure
Blood pressure generally follows a Gaussian distribution (normal) in the general population, and it makes Gaussian mixture models a suitable candidate for modelling blood pressure behaviour.
7. Shoe Size

Have you wondered what would have happened if the glass slipper left by Cinderella at the prince’s house fitted another woman’s feet? He would have ended up marrying another woman. It has been one of the most amusing assumptions we all have ever come across. As per the data collected in the US, female shoe sales by size are normally distributed because the physical makeup of most women is almost the same.
8. Birth Weight


The normal birth weight of a newborn ranges from 2.5 to 3.5 kg. The majority of newborns have normal birthweight whereas only a few percent of newborns have a weight higher or lower than normal. Hence, birth weight also follows the normal distribution curve.
9. Student’s Average Report
Nowadays, schools are advertising their performances on social media and TV. They present the average result of their school and allure parents to get their children enrolled in that school. School authorities find the average academic performance of all the students, and in most cases, it follows the normal distribution curve. The number of average intelligent students is higher than most other students.
The rolling two dice and summing them example and the flipping coins example are discrete binomial distributions not normal distributions.
example of weights of frogs in Normal(gaussian) distribution please tell me that one.???
The normal Distribution is widely used in understanding distributions of factors in the population because the normal distribution approximates many natural phenomena so well, it has developed into a strandard of reference for many probability prombles.
i think in this example they’ve considered probabily of rollin a dice !!
Income distribution is closed at one end – no-one gets an income of less than 0 – whereas some ‘earn’ millions so you have a very long thin tail off to one side only. So it’s not really a normal distribution. This also explains why the income mean is higher than the median which in turn is higher than the mode.
That’s what I will say. Thanks
Normal distribution is about spread of values around averages. So income can be below or above average. It is deviation from average that is important and not actual income ( which of course cannot be below zero)
No one has income less than 0.
O bless your sweet heart child.
I find it really annoying how you put earn in quotations as if people with a lot of money somehow haven’t earned it. Pinko scum.
Le Capital ~ You can flip that idea. If someone gets a welfare check, did they “earn” it..? It’s a fair use of quotations to describe a general idea of income.
Potato, potahto; semantics, semiotics
Patrick ~ Of all the examples in this blog, wealth is least normally distributed, agree.
Sounds like a personal problem
Capitalists “””””earn””””” the money because your ideal system allows them to exploit the workers and make tons of profit from their sweat. You know why this happens? Why people don’t rebel and just take over the means of production and share the profits between them, like happens very successfully for example in the Mondragon cooperative? This happens because of people like you, who try to persuade everyone that living in a society where few own everything is absolutely normal.
Born into a wealthy family, lotto, inheritance are just a few examples of wealth that are not earned.
Eh oui..
If you think the amount of money you earn should be fair, then most of multi millionaires or billionaires didn’t earn the totality of the money. Capitalism is the best system, but it is not perfect.
Yes, that would be the Pareto distribution.
very useful and easy to understand.
very useful
Very nice examples.Thank you for this eye-opening article.
yes love it!