
The field of biology offers a vast array of project ideas that allow students to explore various aspects of living organisms and their environments. These projects provide opportunities to investigate and better understand the intricate mechanisms, processes, and interrelationships within the biological world. By engaging in biology projects, students can develop essential scientific skills such as observation, experimentation, data analysis, and critical thinking. Whether it involves studying the effects of environmental factors on plant growth, exploring genetic inheritance patterns, investigating microbial interactions, or analyzing the impact of pollutants on ecosystems, biology projects offer a hands-on and stimulating approach to learning about the living world. These projects not only foster a deeper understanding of biological concepts but also encourage students to ask questions, make hypotheses, and explore potential solutions to real-world challenges. Overall, biology projects provide a platform for students to cultivate their scientific curiosity and contribute to our understanding of the natural world. Let’s discuss some of these projects in detail.
1. Effects of Temperature on Seed Germination
Objective
The objective of this project is to investigate the relationship between temperature and seed germination rates.

Materials Required
- Seeds of the same plant species
- Petri dishes or seed trays
- Filter paper or sterile cotton pads
- Water
- Thermometer
- Incubator or controlled environment chambers
- Labels
- Stopwatch or timer
Procedure
Preparation
- Select the plant species you want to study and gather the seeds.
- Sterilize the petri dishes or seed trays to create a sterile environment for the seeds.
- Cut filter paper or sterile cotton pads to fit the petri dishes or seed trays.
- Moisten the filter paper or sterile cotton pads with water and place them in the petri dishes or seed trays.
- Divide the seeds into groups, labeling each group according to the temperature conditions it will be exposed to.
Germination setup
- Place a specified number of seeds on the moist filter paper or sterile cotton pads in each petri dish or seed tray. Keep track of the number of seeds in each group.
- Close the petri dishes or cover the seed trays to create a sealed environment that retains moisture.
- Place the petri dishes or seed trays in an incubator or controlled environment chambers set at different temperature conditions, such as 15°C, 20°C, 25°C, 30°C, and 35°C.
- Ensure that the temperature remains constant throughout the experiment by monitoring it regularly with a thermometer.
Germination monitoring
- Start the stopwatch or timer as soon as the seeds are placed in the temperature-controlled environments.
- Check the petri dishes or seed trays daily, observing and recording the number of germinated seeds in each group.
- Remove any germinated seeds from the petri dishes or seed trays to prevent interference with subsequent observations.
- Continue monitoring the seeds until no further germination occurs in any of the groups for a certain predetermined period, such as one week.
Data collection and analysis
- Record the number of germinated seeds for each temperature condition at regular intervals.
- Calculate the germination percentage for each group by dividing the number of germinated seeds by the total number of seeds in the group and multiplying by 100.
- Graph the germination percentages against the different temperature conditions.

- Analyze the data to identify any trends or patterns in seed germination as influenced by temperature.
Conclusion
Based on the observed data and analysis, draw conclusions about the effects of temperature on seed germination. Discuss any significant differences or trends observed between the temperature conditions and their impact on seed germination.

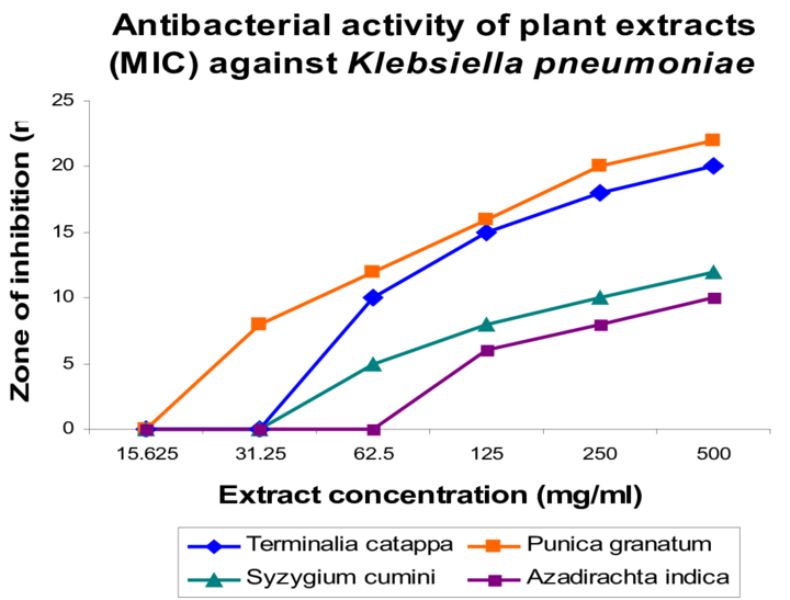
2. Antibacterial Properties of Natural Substances
Objective
The objective of this project is to examine the antibacterial effects of various natural substances.

Materials Required
- Natural substances to be tested (e.g., garlic, honey, lemon juice, tea tree oil, etc.)
- Nutrient agar plates
- Sterile swabs
- Petri dishes
- Sterile forceps or tweezers
- Incubator
- Bacterial cultures (e.g., Escherichia coli, Staphylococcus aureus)
- Distilled water
- Labels
- Stopwatch or timer
Procedure
Preparation
- Sterilize the petri dishes to create a sterile environment for bacterial growth. Ensure the agar plates are properly sealed.
- Obtain the natural substances to be tested. If necessary, prepare different concentrations or dilutions of the substances.
- Label the petri dishes and nutrient agar plates accordingly to identify the different substances and concentrations being tested.
- Prepare bacterial cultures of Escherichia coli and Staphylococcus aureus using sterile techniques or obtain pre-prepared cultures.
- Allow the agar plates to reach room temperature before proceeding.
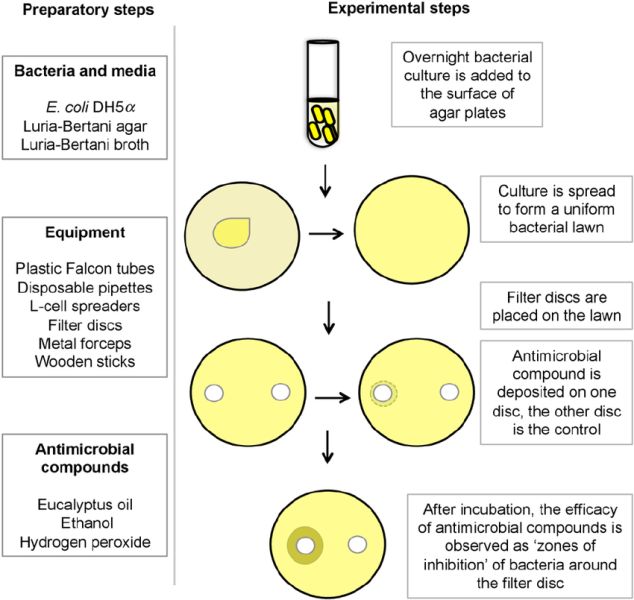
Inoculation
- Using sterile forceps or tweezers, streak the bacterial cultures (E. coli and S. aureus) onto separate nutrient agar plates in a standardized pattern (e.g., streaking for isolated colonies).
- Allow the agar plates to dry for a few minutes to ensure the bacterial cultures adhere to the surface.
Application of natural substances
- Apply a small amount of each natural substance to be tested onto a sterile swab or directly onto the surface of the bacterial cultures.
- Gently streak the swab or spread the substance evenly across the surface of the agar in the designated petri dishes.
- Repeat the process for each natural substance and concentration being tested, ensuring proper labeling of each plate.
Incubation
- Close the petri dishes and place them in an incubator set at an appropriate temperature for bacterial growth (e.g., 37°C for most common bacterial cultures).
- Allow the plates to incubate undisturbed for a specified period, usually 24-48 hours, to allow for bacterial growth and observation.
Observation and data collection
- After the incubation period, remove the plates from the incubator and carefully observe the growth patterns on each plate.
- Record and document the presence or absence of bacterial colonies, their size, and any zones of inhibition around the areas where natural substances were applied.
- Take clear photographs or sketches of the plates for future reference and documentation.
Data analysis
- Compare the growth patterns and zones of inhibition on the agar plates with the different natural substances.
- Analyze and interpret the data to determine the antibacterial effectiveness of each tested substance.
- Calculate the zone of inhibition diameter (if present) to quantify the antibacterial activity, if applicable.
Conclusion
Based on the observations and data analysis, draw conclusions regarding the antibacterial properties of the natural substances tested. Discuss any potential correlations or differences in antibacterial effectiveness against the tested bacterial cultures. Additionally, consider the implications and potential applications of these natural substances as alternatives to conventional antibiotics.
3. The Impact of pH on Enzyme Activity
Objective
The objective of this project is to investigate how changes in pH affect enzyme activity.
Materials Required
- Enzyme solution (e.g., amylase, catalase)
- Substrate solution (specific to the enzyme used)
- Buffer solutions of varying pH (e.g., pH 3, 5, 7, 9, and 11)
- Test tubes or small cuvettes
- Stopwatch or timer
- Spectrophotometer or colorimeter (if applicable)
- Distilled water
- Labels
- Pipettes or droppers
Procedure
Preparation
- Prepare the buffer solutions of varying pH using appropriate buffers or acid/base solutions. Label each solution accordingly.
- Prepare the enzyme solution according to the manufacturer’s instructions or use pre-prepared enzyme solutions.
- Prepare the substrate solution according to the specific requirements of the enzyme being used.
Setting up the experiment
- Label a series of test tubes or small cuvettes with the corresponding pH values (e.g., pH 3, pH 5, pH 7, pH 9, pH 11).
- Place the same volume of the enzyme solution into each labeled test tube or cuvette.
- Add the same volume of substrate solution to each test tube or cuvette, ensuring that the enzyme and substrate are mixed well.
Investigating the effect of pH on amylase activity
pH adjustment
- Using a pipette or dropper, add the respective buffer solution of pH 3, 5, 7, 9, or 11 to each test tube or cuvette containing the enzyme-substrate mixture.
- Ensure that the final pH in each test tube or cuvette corresponds to the intended pH value.
Incubation and reaction time
- Start the stopwatch or timer as soon as the buffer solution is added to the enzyme-substrate mixture.
- Allow the reaction to proceed for a specified duration (e.g., 1 minute, 5 minutes, etc.). Ensure consistency in the reaction time for all samples.
Stopping the reaction
- Add a stopping solution (e.g., acid or base) or use other appropriate methods to terminate the enzyme-substrate reaction in all test tubes or cuvettes simultaneously.
- Make sure the stopping solution used does not interfere with subsequent analysis, if applicable.
Measurement of enzyme activity
- If the enzyme reaction produces a measurable product (e.g., a color change), use a spectrophotometer or colorimeter to measure the absorbance or intensity of the product.
- Follow the instrument’s instructions to record the measurements for each sample. If no instrument is available, visual observation of changes in color or other visible indicators can be used.
Data analysis and interpretation
- Analyze the recorded data, considering factors such as the rate of reaction or the amount of product formed.
- Compare the enzyme activity at different pH levels and identify any patterns or trends.
- Plot the enzyme activity (e.g., absorbance or intensity) against the corresponding pH values to visualize the relationship between pH and enzyme activity.
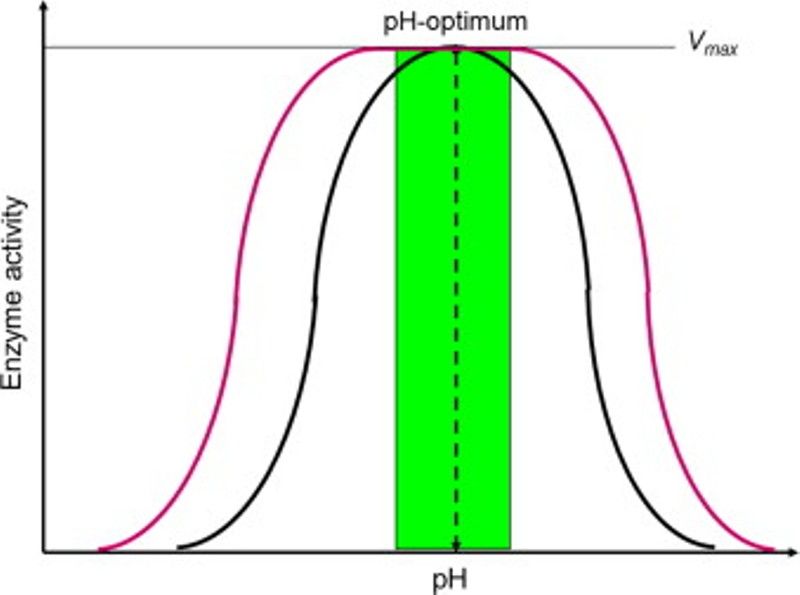
Conclusion
Based on the data and analysis, draw conclusions regarding the impact of pH on enzyme activity. Discuss any optimal pH ranges for enzyme activity and any observed deviations from the optimum. Consider the underlying mechanisms and factors that contribute to the pH-dependent activity of enzymes.
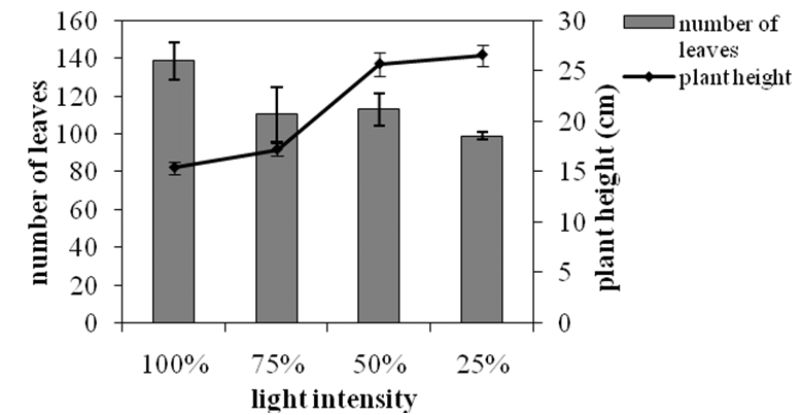
4. The Effect of Light on Plant Growth
Objective
The objective of this project is to study the influence of different light conditions on plant growth.
Materials Required
- Plant seeds of the same species (e.g., bean seeds)
- Planting pots or containers
- Potting soil
- Water
- Light sources (e.g., natural sunlight, fluorescent lights, LED lights)
- Timer or clock
- Labels
- Ruler or measuring tape
- Notebook or data recording sheet
Procedure
Preparation
- Fill the planting pots or containers with potting soil, leaving enough space for seedling growth.
- Plant the seeds in the pots according to the recommended depth and spacing for the chosen plant species.
- Water the pots thoroughly, ensuring the soil is evenly moist but not waterlogged.
- Label each pot to identify the light conditions it will be exposed to.
Light exposure setup
- Choose different light sources to represent different light conditions, such as natural sunlight, fluorescent lights, or LED lights.
- Position the pots in different areas to represent the light treatments. For example, place some pots near a window for natural sunlight and others under artificial light sources.
- Ensure that the light sources provide consistent intensity and duration throughout the experiment. Use a timer or clock to control the light exposure.

Light exposure schedule
- Determine the light exposure schedule based on the plant species’ light requirements or preferences. For example, provide 12-16 hours of light per day for most common plants.
- Set up a regular schedule, ensuring the same duration and intensity of light exposure for all pots.
- Record the light exposure schedule in your notebook or data recording sheet.
Maintenance
- Water the pots regularly, maintaining the soil moisture level appropriate for the chosen plant species.
- Ensure that all pots receive equal care and attention regarding watering, temperature, and other environmental factors.
Growth observation and measurement
- Observe and record the growth of the plants at regular intervals (e.g., once a week).
- Measure the plant height using a ruler or measuring tape, starting from the soil surface to the highest point of the plant.
- Record any additional growth-related observations, such as leaf development, root growth, or the appearance of flowers or fruits.
Data collection and analysis
- Compile the recorded plant growth data, including height measurements and any additional observations.
- Compare and analyze the growth patterns and differences among the different light treatments.
- Consider factors such as plant height, leaf size, overall health, or any visible signs of stress.
Conclusion
Based on the data and analysis, draw conclusions regarding the effect of light on plant growth. Discuss any observed variations in growth patterns and overall plant health due to the different light conditions. Consider the implications of light availability on photosynthesis, chlorophyll production, and plant metabolism.
5. Biodiversity in Local Ecosystems
Objective
The objective of this experiment is to assess and compare the biodiversity of different local ecosystems.
Materials Required
- Field notebook
- Camera or smartphone for documentation
- Field guides or online resources for species identification
- Measuring tape or ruler
- Magnifying glass or hand lens
- Sample collection tools (e.g., nets, traps, containers)
- GPS device or smartphone with GPS capabilities (optional)
- Weather-appropriate clothing and footwear
- Safety equipment (e.g., gloves, goggles)
Procedure
Selection of Study Sites
- Identify and select multiple local ecosystems that you want to study, such as a forest, grassland, wetland, or urban park. Ensure they are easily accessible and safe for fieldwork.
- Obtain necessary permissions or permits if required for conducting research in the selected areas.
Preparatory Work
- Research and gather background information about the ecosystems you have chosen, including their typical biodiversity, key species, and any ongoing conservation efforts.
- Familiarize yourself with common identification features and characteristics of local flora and fauna.
Site Survey
- Visit each selected ecosystem and establish a defined study area within it.
- Record the location and relevant environmental factors such as temperature, humidity, and sunlight availability.
- Create a sketch or map of the study area, noting landmarks and any distinctive features.
Sampling Methods
- Choose appropriate sampling methods depending on the ecosystem and the organisms of interest. Examples include:
Visual observation
Record species sightings and their abundance in a given time frame.
Transect survey
Walk along a designated path, recording all species encountered within a specified distance on either side.
Quadrat sampling
Establish a square or rectangular frame at various locations and record all species within it.
Capture and release
Use nets, traps, or containers to collect samples for identification and later release unharmed.
- Randomize the sampling locations within the study area to ensure representative data collection.
- Note the date and time of each sampling event.
Data Collection
- Document each species encountered, including plants, insects, birds, mammals, and any other relevant taxa.
- Take clear photographs or make sketches of organisms for later identification.
- Record relevant details for each species, such as size, coloration, behavior, and habitat preferences.
- Measure abiotic factors like soil pH, temperature, or water quality, if relevant to your study.
Species Identification
- Use field guides, online resources, or expert assistance to identify the collected species.
- Note down the scientific and common names of identified species.
- Keep a record of any new or rare species encountered.
Data Analysis
- Organize your data by ecosystem type and sampling location.
- Calculate species richness (the total number of different species) and species diversity (taking into account the abundance of each species) for each ecosystem.
- Compare the biodiversity metrics among different ecosystems and draw conclusions based on the results.
Summarize
Summarize your findings, highlighting any patterns or variations observed in biodiversity across the studied ecosystems. Discuss the significance of your results and potential implications for conservation efforts.
Reporting and Presentation
Prepare a report or presentation of your experiment, including the methodology, data collected, analysis, and conclusions. Use visual aids like graphs, charts, or photographs to support your findings.
Reflection and Future Directions
Evaluate the strengths and limitations of your study and suggest improvements for future investigations. Discuss potential research questions that arise from your findings and areas that require further exploration.
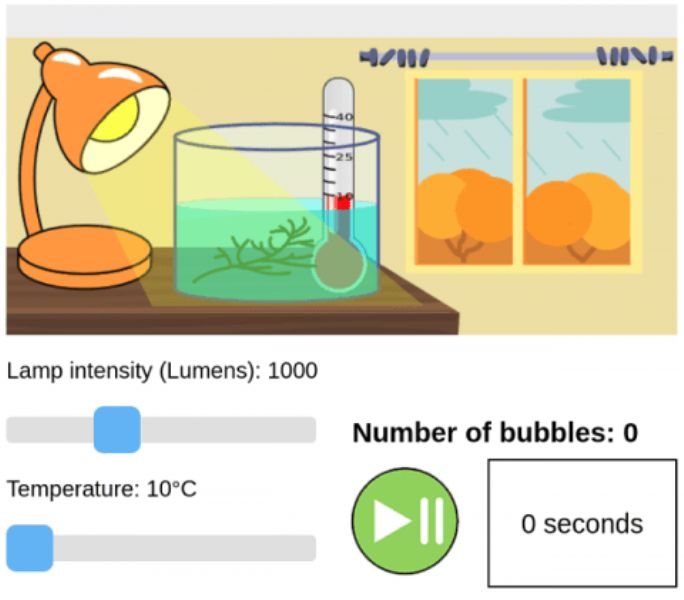
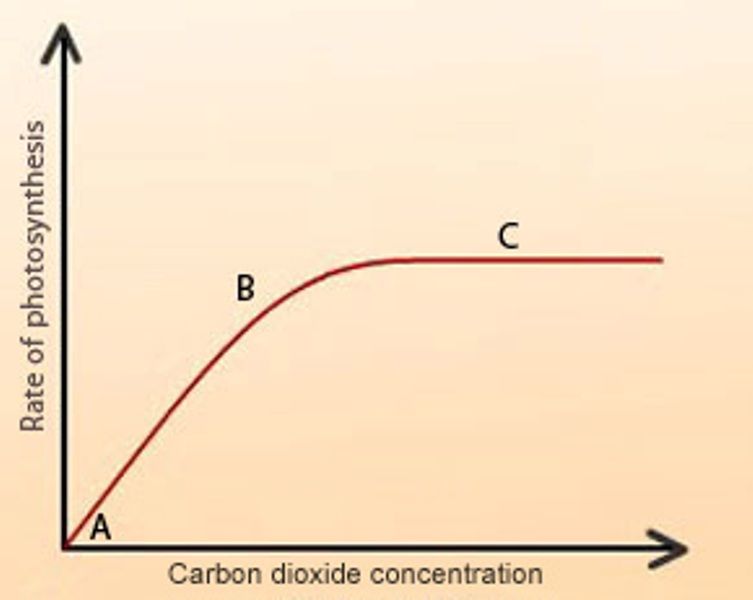
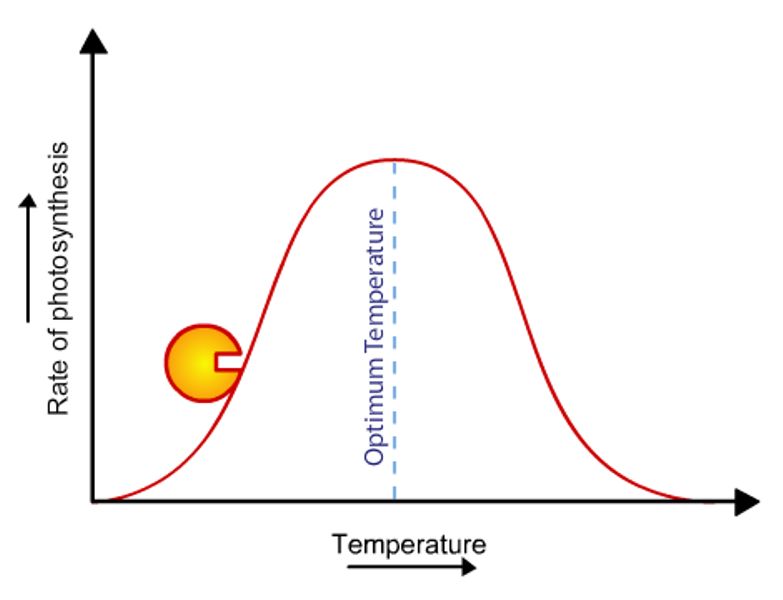
6. Investigating Factors Affecting Photosynthesis
Objective
The objective of this project is to analyze the impact of variables such as light intensity, temperature, and carbon dioxide levels on photosynthesis.
Materials Required
- Potted plants (of the same species)
- Light source (lamp or sunlight)
- Thermometer
- Stopwatch or timer
- Sodium bicarbonate (baking soda)
- Graduated cylinder
- Water
- Plastic wrap
- Scissors
- Paper clips
- Tape
Procedure
Plant preparation
- Select healthy potted plants of the same species for the experiment. Ensure that the plants have been exposed to similar environmental conditions before the experiment.
- Label each plant with a unique identifier or number.
Variable selection
- Identify the variables that will be tested in the experiment. Examples of variables that can be investigated include light intensity, carbon dioxide concentration, and temperature. Choose one variable to test at a time while keeping other factors constant.
Control setup
- Set up a control group by placing one potted plant in a well-lit area with normal atmospheric conditions.
- Place the control plant away from any direct artificial light sources.
Light intensity experiment
- Set up several additional potted plants in a similar environment as the control group.
- Adjust the distance between the light source and each plant to create different light intensities.

- Measure the light intensity at each distance using a light meter or follow the manufacturer’s instructions for the light source.
- Start the timer and record the time.
- Leave the plants exposed to the different light intensities for a fixed duration (e.g., 30 minutes).
- After the specified duration, stop the timer and record the time.
- Measure the temperature and record it for each plant.
- Measure the rate of photosynthesis by counting the number of oxygen bubbles released from the cut end of a stem (or any other suitable method). Repeat this step for each plant and calculate the average rate of photosynthesis.
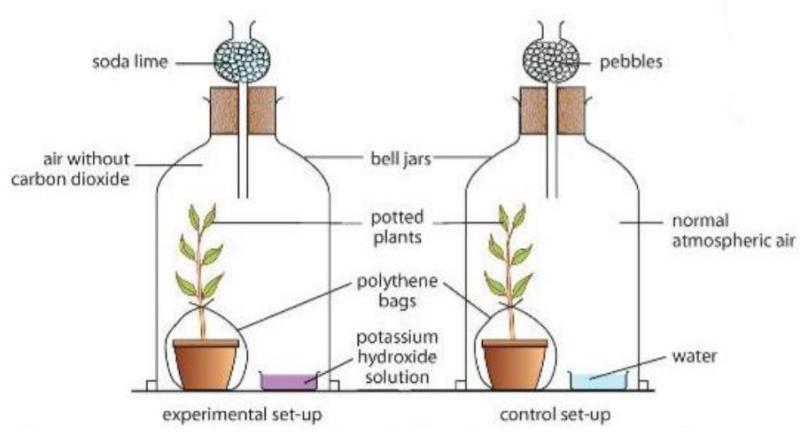
Carbon dioxide concentration experiment
- Set up several additional potted plants in a similar environment as the control group.
- Prepare a sodium bicarbonate solution by dissolving a known amount (e.g., 1g) of sodium bicarbonate in a graduated cylinder filled with water.
- Place the potted plants under a plastic wrap tent.
- Using a pipette, inject a specific volume (e.g., 10ml) of the sodium bicarbonate solution into the tented environment to increase the carbon dioxide concentration.

- Start the timer and record the time.
- Leave the plants exposed to the increased carbon dioxide concentration for a fixed duration (e.g., 30 minutes).
- After the specified duration, stop the timer and record the time.
- Measure the temperature and record it for each plant.
- Measure the rate of photosynthesis as in step 4g, and calculate the average rate of photosynthesis.
Temperature experiment
- Set up several additional potted plants in a similar environment as the control group.

- Adjust the temperature around each plant using heating pads or cooling fans to create different temperature conditions.
- Measure the temperature and record it for each plant.
- Start the timer and record the time.
- Leave the plants exposed to different temperature conditions for a fixed duration (e.g., 30 minutes).
- After the specified duration, stop the timer and record the time.
- Measure the rate of photosynthesis as in step 4g, and calculate the average rate of photosynthesis.
Data analysis
- Organize the data collected from each experiment, including light intensity, carbon dioxide concentration, temperature, and the corresponding rate of photosynthesis.
- Analyze the data to identify any trends or patterns.
- Draw conclusions based on the experimental results and discuss how each variable affects the rate of photosynthesis.
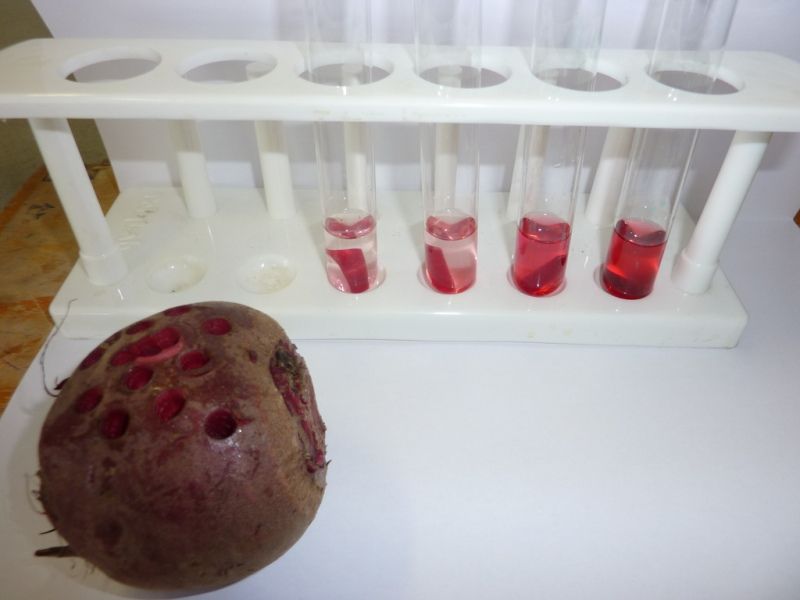
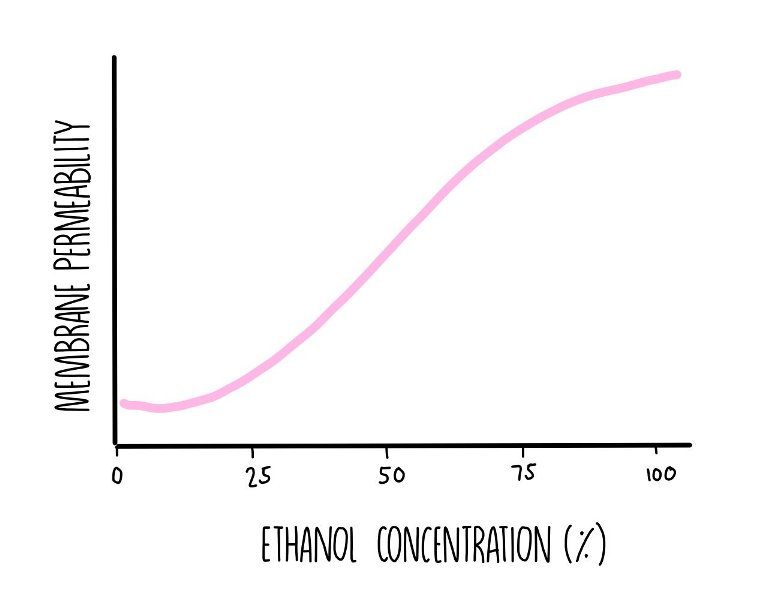
7. Cell Membrane Permeability
Objective
The objective of this project is to examine the permeability of different substances through a cell membrane.

Materials Required
- Dye (or small molecule)
- Cell membrane (for example a lipid bilayer)
- Stopwatch
- Calculator
- Pot (container)
- Water
- Notebook
- Pen
Procedure
Experimental Setup
- Prepare a solution of interest that contains a substance you want to test for membrane permeability. For example, you can use a dye or a small molecule.
- Obtain a sample of cells or create an artificial membrane model, such as a lipid bilayer, to mimic the cell membrane. The cells can be from a specific organism or a cell line, depending on the purpose of your experiment.
Control Group
- Prepare a control group by adding the substance of interest to a solution that does not contain any cells or membranes. This will help establish a baseline for the substance’s behavior in the absence of a cell membrane.
Experimental Group
- Take a sample of cells or create an artificial membrane model in a suitable container.
- Add the substance of interest to the container, ensuring that it comes into contact with the cell membrane or artificial membrane model.
- Allow the substance to interact with the membrane for a specific period, depending on the experimental requirements.
Quantification of Permeability
- After the desired incubation time, collect a sample from the container to measure the amount of substance that has passed through the cell membrane or artificial membrane model.
- If using cells, carefully remove them from the solution using techniques such as centrifugation or filtration. If using an artificial membrane, collect the solution on the other side of the membrane.
- Measure the concentration or quantity of the substance in the collected sample. This can be done using various analytical techniques, such as spectroscopy, chromatography, or enzyme assays.
Data Analysis
- Compare the concentration or quantity of the substance in the control group with that in the experimental group.
- Calculate the permeability of the cell membrane or artificial membrane model by determining the rate or extent of substance passage through the membrane. This can be done by comparing the amount of substance in the control and experimental samples.
- Statistical analysis may be necessary to determine the significance of the results and to compare multiple experimental conditions or treatments.
Repeat and Validate
- To ensure the reliability and reproducibility of your results, repeat the experiment multiple times with both the control and experimental groups.
- Validate your findings by comparing them with existing literature or previous studies on cell membrane permeability.
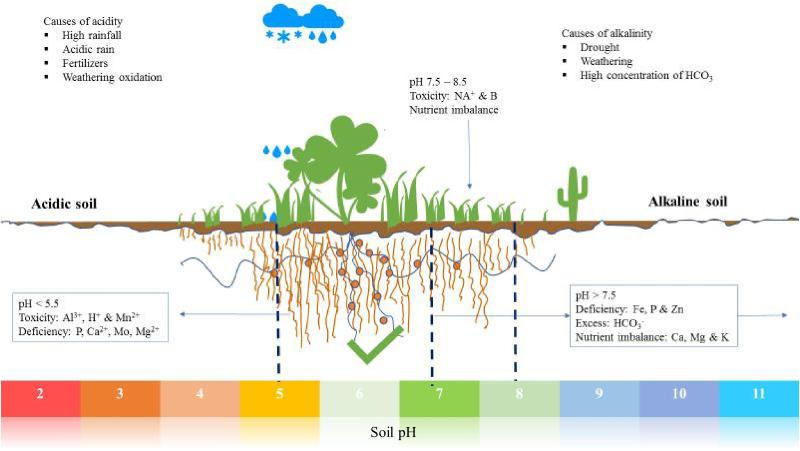
8. The Relationship Between Soil Type and Plant Growth
Objective
The experiment aims to investigate the influence of different soil types on plant growth. Understanding how soil composition affects plant growth is crucial for optimizing agricultural practices and ensuring successful crop production. By examining the relationship between soil type and plant growth, we can gain valuable insights into the suitability of different soils for various plants.
Materials Required
- Various soil types (e.g., sandy soil, loamy soil, clay soil)
- Plant seeds of the same species (e.g., tomato, lettuce, or bean)
- Planting pots or containers
- Measuring tools (ruler or tape measure)
- Watering can or spray bottle
- Natural light source
- Notebook or data recording sheet
- Camera or smartphone for visual documentation
Procedure
Soil Preparation
- Gather soil samples of different types (sandy, loamy, clay) from various locations or purchase them from a reliable source.
- Ensure that the soil samples are free from contaminants or foreign matter.
- Label each container or pot with the corresponding soil type.
Plant Selection
- Choose a plant species that is commonly grown and suitable for experimentation, such as tomatoes, lettuce, or beans.
- Ensure the seeds are of the same variety to minimize genetic variability.
Planting
- Fill each pot or container with a specific soil type, leaving enough room for the plant’s root system to grow.
- Plant the seeds according to the recommended depth and spacing for the selected plant species.
- Maintain consistency in planting depth, seed placement, and watering across all soil types.
Environmental Conditions
- Place all pots or containers in an area with access to natural light or under controlled grow lights.
- Ensure that the temperature, humidity, and light conditions remain consistent throughout the experiment.
Watering and Maintenance
- Water the plants regularly, maintaining a consistent watering schedule for all soil types. Avoid overwatering or underwatering.
- Record the amount of water used for each watering session.
- Monitor the plants for signs of pests or diseases and take necessary measures to ensure plant health.
- Rotate the position of the pots periodically to prevent any positional bias.
Data Collection
- Measure and record the plant growth parameters, such as height, leaf count, and number of branches, at regular intervals (e.g., weekly).
- Take photographs or make sketches to document the visual differences in plant growth between the soil types.
- Note any observations or anomalies during the experiment.
Data Analysis
- Compile the recorded data for each soil type and plant growth parameter.
- Calculate the average growth rate and compare the results between soil types.
- Use statistical analysis methods, such as t-tests or ANOVA, to determine if there are significant differences in plant growth among the soil types.
Conclusion
- Analyze the data and draw conclusions based on the observed differences in plant growth among the soil types.
- Discuss any limitations or factors that may have influenced the results.
- Provide recommendations for future studies or practical applications.
9. Investigating Genetic Inheritance
Objective
The objective of this project is to investigate the patterns of genetic inheritance by analyzing the traits passed down from parent organisms to their offspring.
Materials Required
- Organisms with known genetic traits (e.g., fruit flies, plants, or other organisms suitable for genetic studies)
- Controlled breeding setup (cages, pots, or other suitable containers)
- Genetic markers or phenotypic indicators for the traits under investigation (e.g., eye color, flower color, or other observable characteristics)
- Lab equipment (microscopes, petri dishes, pipettes, etc.)
- Punnett squares or other genetic analysis tools
Procedure
Selection of Parent Organisms
- Choose parent organisms that exhibit distinct and easily observable genetic traits. These traits should have clear phenotypic differences.
- Ensure that the parent organisms are healthy and free from any known genetic disorders or mutations.
Controlled Breeding Setup
- Set up separate breeding containers for each pair of parent organisms.
- Maintain controlled environmental conditions such as temperature, light, and humidity to minimize external factors that could influence the traits being studied.
Breeding Process
- Introduce the selected parent organisms into their respective breeding containers.
- Allow the parent organisms to mate and produce offspring naturally.
- Record the mating pairs and the number of offspring produced.
Observation and Data Collection
- Carefully observe the offspring for the specific genetic traits under investigation. Record any observable differences or similarities.
- Use appropriate phenotypic indicators or genetic markers to identify the expression of traits.
- Keep accurate records of the traits exhibited by each offspring.
Analysis and Interpretation
- Analyze the observed data to identify patterns of inheritance.
- Use Punnett squares or other genetic analysis tools to predict the expected phenotypic ratios based on the known genotypes of the parent organisms.
- Compare the observed ratios with the predicted ratios to determine if the inheritance follows expected Mendelian patterns.
Replication and Statistical Analysis
- Repeat the breeding process and observation with multiple pairs of parent organisms to ensure the reliability of the results.
- Perform statistical analysis, such as chi-square tests or other appropriate tests, to determine the significance of any deviations from expected ratios.
Conclusion
- Based on the data and analysis, draw conclusions about the patterns of genetic inheritance observed.
- Discuss any deviations from expected ratios and propose possible explanations.
- Summarize the findings and their implications in the context of genetic inheritance.
Further Exploration
- If necessary, conduct additional experiments to investigate specific aspects of genetic inheritance or to explore more complex inheritance patterns.
- Explore other factors that may influence inheritance, such as environmental factors or the presence of multiple genes affecting a trait.
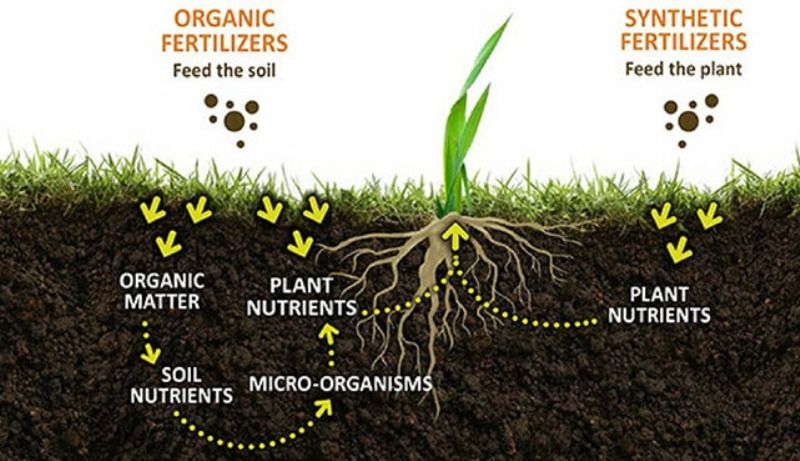
10. The Effect of Fertilizers on Plant Growth
Objective
The objective of this project is to investigate the impact of different fertilizers on the growth of plants.
Materials Required
- Several identical plant specimens of the same species
- Different types of fertilizers (organic and synthetic)
- Measuring instruments (ruler, measuring cups, etc.)
- Potting soil
- Planting containers or pots
- Watering can or spray bottle
- Notebook or data recording sheet
Procedure
Selection of Plant Specimens
- Choose plant specimens of the same species and similar size to ensure consistency.
- Ensure that the plants are healthy and free from any existing nutrient deficiencies.
Preparation of Planting Containers
- Fill the planting containers or pots with the same amount of potting soil.
- Label the containers to distinguish between the different fertilizer treatments.
Application of Fertilizers
- Follow the manufacturer’s instructions for each type of fertilizer.
- Apply the specified amount of each fertilizer to the respective planting containers.
- Leave one container as the control group with no fertilizer applied.
Planting the Specimens
- Plant one specimen in each container at the same depth.
- Make sure the plants are positioned centrally and receive equal exposure to light.
Watering and Maintenance
- Water the plants regularly to maintain consistent moisture levels.
- Ensure that all plants receive the same amount of water throughout the experiment.
- Keep track of watering and maintenance activities.
Monitoring and Data Collection
- Observe and measure the growth of the plants at regular intervals (e.g., weekly).
- Record data such as plant height, number of leaves, or any other relevant growth indicators.
- Take photographs or make sketches to visually document the growth progress.
Analysis and Comparison
- Compare the growth of plants in different fertilizer treatments with the control group.
- Analyze the data collected and look for patterns or significant differences.
- Consider factors such as plant height, leaf number, overall health, and any visible abnormalities.

Conclusion
- Draw conclusions based on the analyzed data.
- Determine if any fertilizer treatments resulted in significant differences in plant growth compared to the control group.
- Discuss the effectiveness of different fertilizers and their impact on plant growth.
Further Exploration
- If necessary, conduct additional experiments to explore the effects of different concentrations or combinations of fertilizers.
- Investigate the long-term effects of fertilizers on plant growth or the impact on specific plant species.
- Explore the influence of other factors, such as environmental conditions or soil composition, on the efficacy of fertilizers.