As the term indicates, “Total Quality Management (TQM)” is related to managing the overall quality of products or services of an organization. Before discussing TQM in detail, let’s first understand what the term “quality” is all about.
As a customer, while purchasing any product or service, we always consider price and quality both. Our buying decision is majorly based on different quality parameters of product or service such as reliability, durability, features, usage, adaptability, and many more. So, we can say that quality is one of the most important factors that influence the buying decisions and buying patterns of customers. Therefore, it is also considered a crucial success factor in operations in any organization. In a competitive business environment, providing the right quantity of goods at the right time along with superior quality is necessary to meet the demand of customers. There is less importance of other aspects of a product in absence of quality. So, quality has strategic importance for any organization’s survival, growth, and market share. It is considered a base for customer satisfaction and brands are formed by taking advantage of the high quality of their products or services.
Meaning of Quality and Total Quality Management
– Quality
In general terms, “Quality” is viewed as a parameter for making decisions related to whether a product or service is inferior or superior. Usually, our expectations from the term quality are related to the excellence of product or service. In other words, a product is considered a good quality product if it exceeds the minimum expectation level of customers.
Different experts have defined quality in different ways according to this understanding, experience, and research. Few of them are as under:
ISO 9000 standards have defined quality as “the aggregate of the features and characteristics of a product or service that is a concern with its ability for the satisfaction of stated needs”.
Chartered Quality Institute of the UK has defined quality in its broadest way and narrow way. In the broadest way, quality can be considered as a degree of excellence. Wherein, in a narrow way, it has defined quality as:
- Without any defects or contamination.
- Synchronization with requirements.
- Indication of customer satisfaction.
– Total Quality Management (TQM)
After gaining insight into the term “quality”, it is easier to understand the term TQM or total quality management.
It is referred to as a process that is customer-focused and aimed at improving business operations continuously. TQM ensures that all related work (especially the work of manpower) is aligned with the common goals i.e. improving the quality of a product/ service and enhancement of the process of production.
Dimensions of Quality
A product is considered a quality product if it is able to meet the expectation level of customers. There are eight aspects or dimensions of quality through which organizations can meet the expectations of customers. It can be looked at as a strategic management tool that can be utilized as a framework for analyzing characteristics of quality. These dimensions are mentioned below in detail:
1. Performance
This is related to the actual working of a product or service according to its operating characteristics as expected. In other words, performance is the measurement of quality in terms of the actual working of product or service v/s expected working of product or service.
For example, the mileage of a car or average of a bike based on the expectations and reality; is a performance dimension. Similarly, while purchasing a television set, different performance factors are considered such as colors, sound, visuals, clarity. Service sector like hospitality considers quick and courteous service to customers as performance standards of quality.
2. Reliability
Reliability is a close dimension to the performance and focuses on the durability of a product i.e. the consistent performance of a product for a longer duration as per its specifications. This dimension indicates a product’s probability of showing signs of faults within a given time period. There are three measures of reliability i.e.
- First failure’s meantime or the time of failure for the first time
- Amount of time (meantime) between failures
- Rate of failure per unit time
The above measures are generally applicable for long-lasting or durable products or services and less applicable for products having short life or instant products. In the case of costly maintenance and downtime, reliability is considered more important for customers. For example, reliability is the main attribute or dimension of quality for farmers in the case of farm equipment, especially at the time of harvest seasons that are of short period. Similarly, for a programmer, the reliability of a Laptop or Desktop may be a crucial dimension factor.
3. Features
These are considered characteristics that act as a supplement to basic functions. These are the characteristics to decide how a product or service would appeal to customers. These features are in addition to a product’s basic functionalities.
For example, the features of a product can be “live chat support” through chatbots. Another example can be features like automatic updates, battery share, etc. in smartphones are a few attractive features that may appeal to customers.
4. Conformance
This refers to the ability to achieve established standards. In other words, the dimension of conformance is related to the extent up to which a product or service meets the expected level of design and operation specifications. Some types of specifications are there related to different products or services. At the time of development of new design or new product models, there are a defined set of standards introduced for the superior quality of raw material, and dimensions are also defined for parts that are used. These specifications can be taken as the target standards and any deviation from these target standards is allowed within a defined range only.
In the case of the service industry, the measurement of conformance is through unexpected delays, focus on accuracy, and other common errors.
5. Durability
This dimension is related to the time period for which the product will last or work and the circumstances or conditions under which it will work. If a product is repairable, then it is complicated to estimate the duration of the life of a product. In such cases, durability will be added until the time it is beneficial to use from an economic point of view. This situation arises once there is an increase in repairs and repair costs.
For example, if a vehicle is not giving the expected mileage or average and needs to repair frequently, then the repair cost and fuel cost will be increased. So, in such a case, it must be replaced.
6. Serviceability
This is also considered an important dimension of quality that is related to how easy the repair or service is available in the case of a particular product or service. This also includes courtesy, speed, and competence in terms of service. The concerned area of the customer is that in case of a product breakdown, what type of repairing service is there and the time period requires restoring these services. One more concern area would be the service appointments and servicing tasks in a timely manner by service personnel. This also includes the frequency of repairs that are not able to solve the issue. Both, repairing of the product in a timely manner and the satisfaction of customers towards the complaint handling system of the company are equally important in this dimension. This may affect the customer’s decision in evaluating service quality and ultimately, the reputation of the organization. Different organizations can have different approaches to handle complaints and also, the importance level to serviceability is also not the same.
For example, leading banks provide toll-free helpline numbers, email facilities, live chat support through chatbots, etc. to assist customers in their issues and queries.
7. Aesthetics
This is the most subjective dimension as it is mostly based on the preference of individuals and personal judgments. The aesthetics dimension is related to the appearance of a product i.e. how it will look and more concerned with the brand or identity of the organization. Other than the product’s appearance, this dimension also reveals the taste, smell, sound, and overall feel of the product.
For example, while buying perfume or deodorant, some customers prefer mild fragrance. Wherein, some customers demand a strong fragrance. Similarly, few people look for a stylish car with a loud engine. On the other hand, the preference of a few people may be a car with simple looks and a quiet engine.
8. Perceived Quality
It is not always necessary that if there is the perception of anything, then it means it’s the real one. In other words, though a product or service gets a great score on the above dimensions of quality, still, customers can give it a poor rating due to the negative perceptions received from other customers. This may happen as customers sometimes may have incomplete information related to a specific product or service and he/ she depends on the indirect reviews of the product or service for brand comparison. For perceiving quality, reputation has a major role to play. Customers can trust a product’s quality if there are positive reviews of the established product or service.
For example, online sites such as Myntra, Amazon display customer ratings on different products or services of various brands. These reviews of customers act as a base for other customers to make decisions of online shopping of those products or services. Often, those products or services that receive high ratings or reviews from customers are in great demand.
Techniques of Quality Control
A system, through which a product-related or service-related desired level of quality can be maintained, is termed as quality control. It includes controlling different factors in a systematic way that are responsible for affecting a product’s quality.
The techniques of quality control are considered a specific set of procedures and activities that are used to determine a specific quality aspect in order to make conclusive decisions. The various quality control techniques are mentioned as under:
- Off-line Quality Control
- Quality at the Source
- Statistical Process Control
- Acceptance Sampling
- Quality Control Tools
The above techniques are discussed below in detail:
1. Off-line Quality Control
This technique involves measures for selecting the controllable product and parameters of the process by ensuring the minimization of the deviation between the outcome of the product and the standard.
2. Inspection/ Quality at the Source
In quality control, workers of the production department inspect their own work and take corrective actions. It is easy and fast to rectify mistakes due to the immediate inspection of the work once it is done.
Workers are also given authority from their supervisors to discontinue the production in case they find any serious defect. Due to this, workers take the responsibility for quality and feel proud and motivated in their work. The whole process of quality control includes commitment, openness, and active participation and facilitate meeting quality standards.
3. Statistical Process Control
This includes the comparison of the outcome of a process with defined standards and further taking appropriate actions in case of any discrepancy. It also facilitates determining the possibility of a process to make a product that is able to meet the required specifications. Online statistical process control is related to gathering information on a product, service, or process while it is in functional mode.
4. Acceptance Sampling
This quality control technique helps in deciding the acceptance or rejection of the production lot (larger quantities of the product) by inspecting small samples rather than overall inspection. This procedure considers samples on a random basis. In other words, in this method, an equal chance is there for each item of a lot to be a part of the sample being inspected.
So, the sample from a larger production lot will be accepted if defects are on the acceptable level. Else, there will be a rejection of the entire lot. This is also termed as the end of line inspection that categorizes products according to the inspection based sample. In this technique, both buyer and manufacturer are at risk. If there is an increase in sample size and a decrease in the acceptable defectives, then the buyer’s risk decreases. If both parties i.e. manufacturer and buyer agree on making the sample plan double, then there is a fixed range of defectives.
5. Quality Control Tools
Quality control tools are used by various organizations as these tools support them in managing and monitoring activities related to quality control. Though several quality control tools are available, still, there are seven most common and widely used tools that are termed as 7 QC tools. These quality control tools are discussed below in detail:
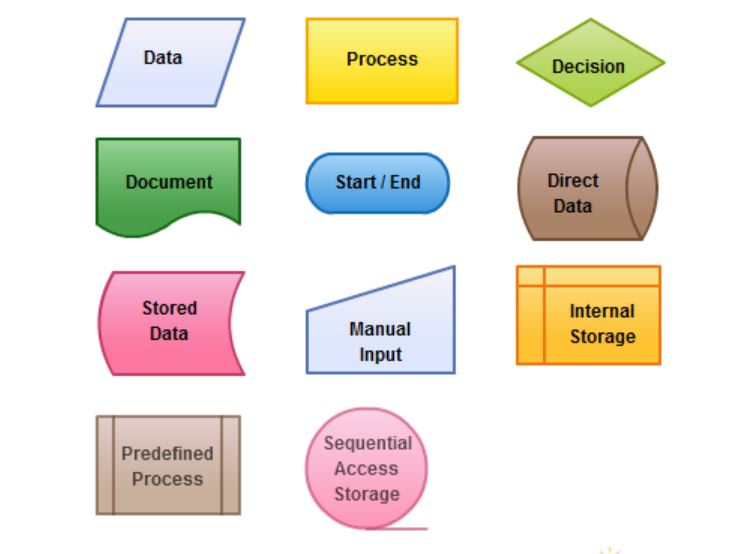
A) Flowchart
A flowchart is considered a diagram to represent the process of work flow, algorithm, or the sequence of a process using connected arrows and symbols or shapes. In other words, a flowchart visually represents a process in various steps. These are useful in visualizing organizational structure and design, process and document workflow, etc.
Through the flowchart, identification of the actual flow of activities under a system is easy. It also helps in determining any quality issues in the process. Locating different problematic areas or improvement areas can be identified as well. The flowchart also facilitates the collection of data in a detailed form and further, analyzing and developing corrective actions. Different steps under flowchart include:
- To make a list of different steps or tasks related to a specific job
- Categorizing them in the form of a decision or a procedure
- Generation of alternatives or options by each decision point
Different symbols that represent flowchart are shown below:
For example, below is the flow chart of the recruitment process of the HR department of an organization:
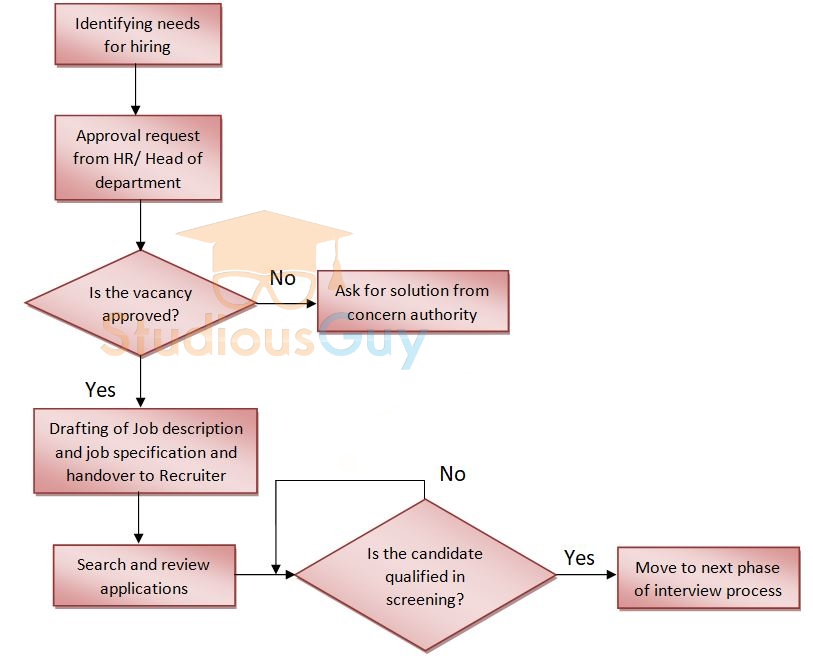
The steps involved in the flowchart are co-related with each other. The output obtained in a step is considered an input for the next step. In case of incorrect input at the initial stage, the final outcome will be incorrect too.
B) Check Sheet
This quality tool is considered a basic quality tool to record data especially the number and types of defects, their occurring locations, occurring time, and workers responsible for the occurrence of such defects. The frequencies of such occurrence are kept as a record in the check sheet. This facilitates implementing corrective measures in case of more frequencies.
The check sheet collects data and information in a user-friendly format. The data collected in the sheet is as per the actual facts. This check sheet is generally in the form of a document or spreadsheet and includes a list of queries or issues to be resolved. It supports the organization in identifying different problems that hinder delivering a quality product.
The check sheet is indicated by putting checks or marks. For example, the HR department of an organization uses a check sheet to keep track of different queries of employees that fall under different categories and are raised every day.
The below table indicates different queries raised by employees under different categories such as insurance, leaves, overtime, gratuity, etc. The information related to the total number of queries handled by HR every day in a week is also mentioned in the table.
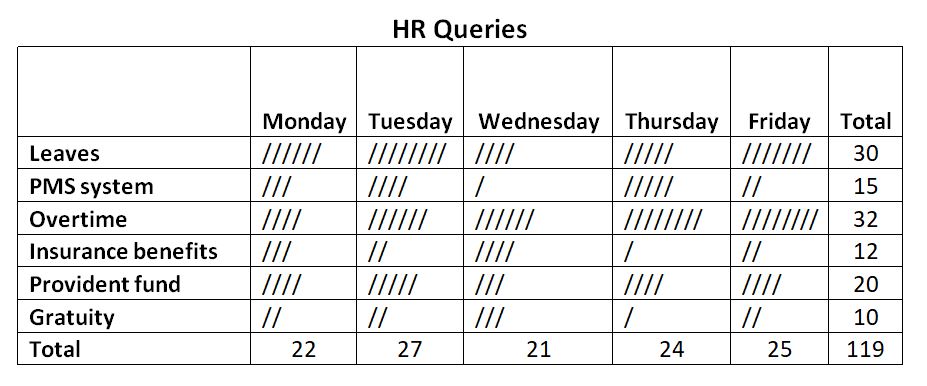
Using the above check sheet, the HR department is able to get the highest number of queries raised by employees in each category. Through this information, it can be ensured that all employees get information on the queries in order to minimize the effort for asking similar queries by different employees.
C) Histogram
A bar chart that graphically represents a pattern of data or information that falls under different conditions is known as a histogram. It usually distributes data and gives the required information on the shape and how the sample data set is distributed. There can be any type of numerical data or information such as total staff joined in a specific month, total complaints received from customers in different categories, marks obtained in exams, etc.
In other words, histograms represent the distribution of data in graphical form. Generally, these are used for the purpose of recording a great volume of data related to a process.
To develop a histogram, the series of values is divided into certain intervals like 5,10,15,20, etc. These intervals are termed as a bin. Also, intervals are equal in size and there is no overlapping among them. Different points, values are counted that come under each interval, and the bar chart is plotted accordingly.
Different elements of the histogram are as under:
The title: It shows the information mentioned on the histogram.
X-axis: These are intervals that depict the scale of values under which measurements exist.
Y-axis: This includes how many times the values appeared within the set intervals of the x-axis.
The bars: Bars include both height and width. The height indicates the total occurrence of values (in numbers) within the interval. Wherein, the width is related to the interval included.
Histogram of sales data
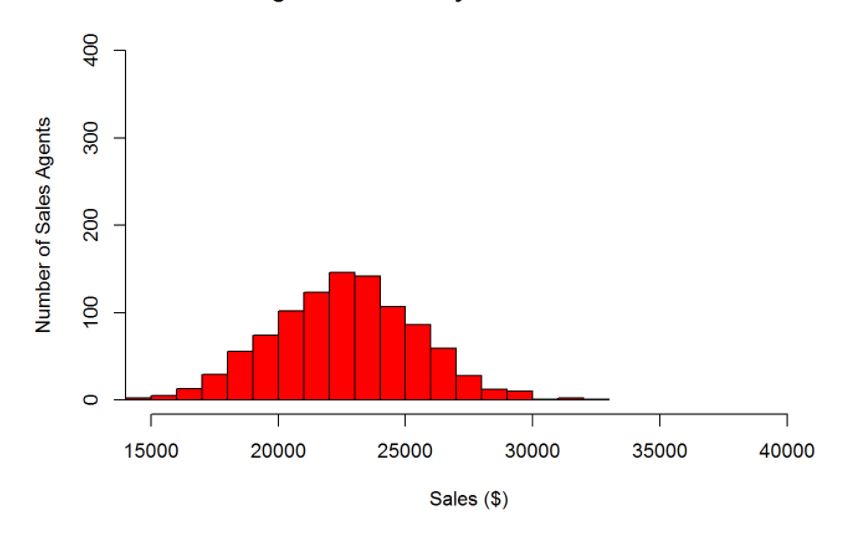
For example, in the above histogram, there are bins for sales of every $1000. So, one bin includes sales in the range of $20,000-$21,000. Similarly, the next bin consists of sales from $21,000 to $22,000, and so on. In order to determine the height of each bin, the total number of observations will be counted in each bin. So, it is observed that there is a balanced sale around the mean i.e. approx. half is less than the average of $22,589 and a half is more than it.
There is a difference between the histogram and bar chart. The data in the histogram is continuous and adjacent. Also, it appears in regular or equal intervals and a gap is not there among different bars in the histogram. Wherein, bar chart includes a gap among different bars.
D) Scatter Diagram
This diagram represents the co-relation among two variables in visual form. In this quality control tool, the representation of data is in the form of a point. Each point shown in the diagram reveals the value on both axes. Among the two variables, one is dependent and another one is independent.
Through a scatter diagram, it is easy to identify the cause-effect relationship in the system. In the case of correlated variables, the points will be inclined towards a line or small curve.
For example, below is a scatter diagram on a given pair of different variables that shows the correlation between these variables.

The two variables are as under:
TM= Total marks gained out of 100
N= Number of students
The values of the TM variable are shown in the form of bins, so, the center point of each class can be used in the scatter diagram. Therefore, the axis of the diagram would be:
X-axis= TM
Y-axis= N
As per the above data given in the table, the below data points will be plotted on the scatter diagram:
(35,15), (45,13),(55,10),(65,8),(75,6),(85,4)
Accordingly, the scatter diagram is as under:
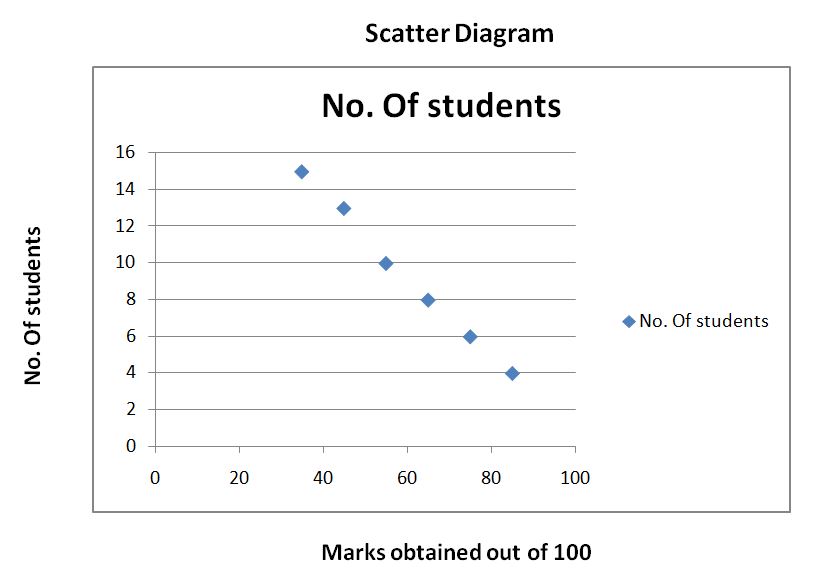
The curve shape shows that very few students got high marks which indicates a negative correlation among both variables.
E) Control Charts
These charts are useful in determining if different processes of an organization are in statistical control state or not. Due to this characteristic of control charts, these are also termed as statistical process control. This is a graphical tool that represents how there are changes in the process over a period of time. The process may have variations because of random reasons and assignable reasons don’t cause any variations. If variables are in control, then they are able to produce a product of desired quality and specifications. This is known as the quality of conformance.
If the analysis under control chart shows that there is stability in the processes and processes are under control or a little variation is there, then, no changes are required to be done for the parameter of process control. In the case of uncontrollable processes, the variation source is determined through control charts. So, we can say, that for the process control parameter, corrective measurements or actions are required. These charts are also known as Run charts. In the below chart, the control chart includes a central line, both upper and lower control limit.
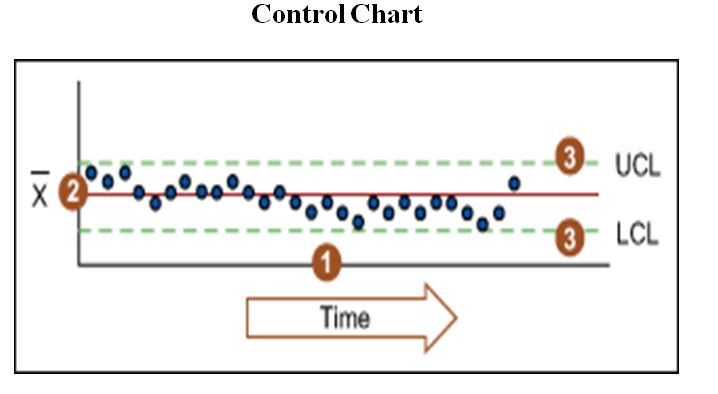
Components of a Control Chart
As shown in the above control, chart, it has mainly three components:
Time series graph: This indicates the beginning of the control chart.
Central line: Indicated as X in the above chart and considered a visual reference to detect trends or shifts. This is also termed as the process location.
Upper and lower control limits: These depict the variation and are calculated from available historical data. Steps involved in the calculation of control limits are as under:
- Estimate the standard deviation i.e. σ of the sample data.
- That standard deviation number is multiplied by three.
- To add (3 multiply σ to the average) for the upper control limit (UCL) and subtract (3 multiply σ from the average) for the lower control limit (UCL).
In mathematical form, the equation of control limits is as under:
![]()
The hate over the symbol of standard deviation i.e. sigma shows the estimated standard deviation.
F) Cause and Effect Diagram
This is also termed as Fish-bone diagram because its shape is somewhat like the side view of the skeleton of a fish. A cause-effect diagram represents different possible causes by recording those causes that can create a defect in quality. This starts with stating a problem or an issue. It facilitates brainstorming because there should be an answer to each question. At last, there should be an agreement of all people on the problem statement and the question will be placed at the top of the fish-bone. The rest part of the fishbone includes a horizontally drawn single line and a vertical line that indicates bone or branches.
Different categories included in these branches are process, procedure, people, material, policies, and equipment. The end of the arrow indicates the effect. Branches and sub-branches depict causes. Once different causes are investigated in a detailed way, then, factors that trigger the problem can be highlighted. After identifying various possible causes, an improvement plan can be developed by using these causes for resolving the problem.
G) Pareto Chart
This includes features of Bar graph and a Line graph that is used to summarize data in graphical form. This data may include time, cost, defect, etc. Values are represented through bars in descending order. In other words, on the left side of the graph, it has the longest bar and the shortest bar is plotted on the right side. Lines represent the cumulative total.
The axis of the left vertical line depicts the frequencies of occurrences related to defects, time, cost, etc. The cumulative percentage of total occurrences is represented through the right vertical axis. Pareto chart is developed by dividing a range of data into groups. These groups are termed as a segment.
For example, let’s say that there is a delay in the processing of credit card applications and the concerned authority wants to examine the process and determine the root cause due to which the delay happened.
In order to make the Pareto chart, the group of data is categorized as under:
- No signature
- No updation of address
- The customer is already registered
- Non-legible handwriting
- Other reason
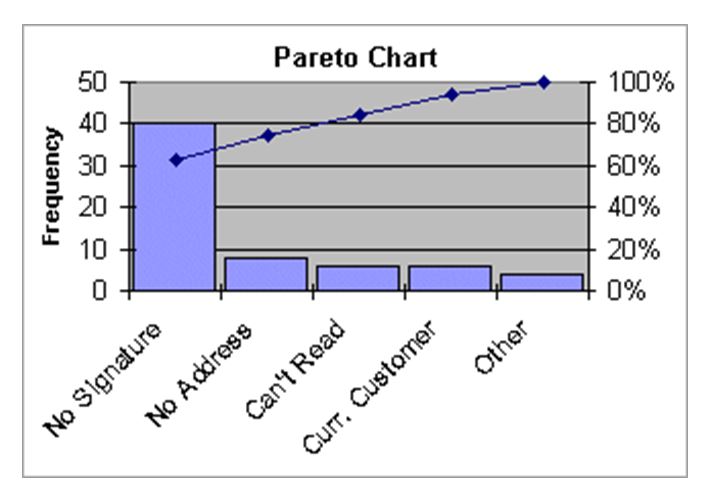
The above diagram shows both the left axis and the right axis. The left side axis contains total occurrences related to each category. Wherein, the cumulative percentage is plotted on the right axis. The category name is represented through a horizontal line. Accordingly, the Pareto chart is drawn that provides information for the biggest concern area.
In the above example, the category of “no signature” has the most occurrences or frequencies. By focusing on this issue, a business can improve its process. This is termed as the Pareto principle and rule of 80:20. This indicates that 20% of the modules are responsible for 80% of the defects that are found. So, by paying attention to 20% of the modules, quality can be improved significantly.
Quality-based Strategy
A strategy is related to plan and supplement different activities by evaluating an organization’s both internal and external environment in order to maximize the returns. It includes an evaluation of the current and future available resources. Accordingly, those activities are planned that are most beneficial. Throughout the above activities, the quality of product or service is a key focus area. To ensure customer satisfaction, quality is required to be maintained at different stages of product development such as design, packing, manufacture, pricing, delivery, and after-sales service. So, we can say, that quality acts as a foundation of any type of strategy. One of the important components of quality includes price. Quality at low prices can be achieved by minimizing the wastage and improving the process. To control costs, there are different techniques available such as lean manufacturing, flexible manufacturing, and just-in-time.
Total Quality Management
TQM (Total quality management) can be viewed as a method through which continuous improvement can be achieved in producing goods and services. It includes both management and quality tools to enhance business and minimize losses that may occur due to wasteful activities. So, TQM is designed specifically to ensure to stop the occurrence of defects by taking preventive measures. Below steps are there in order to achieve total quality management:
- Identification of the customer’s wants or desires and developing methods for generating facts that are useful for decision-making.
- Developing design specifications by converting the wants of customers and ensuring that these specifications are able to meet or exceed the expectation level of customers.
- Processes should be designed in such a way that the job can be done correctly in the first attempt and also, to incorporate those elements through which mistakes won’t happen.
- To maintain records related to all procedures, occurrences, etc. Through this, the validation of processes can be done that ensures continuous improvement. On top of it, it is possible to view any gaps and can be rectified on an immediate basis.
ISO 9000 as a Platform towards TQM – Working with Intranet
ISO 9000 covers international standards related to quality assurance and quality management that are made to facilitate organizations to keep track of their quality management system; and effective documentation of elements of their quality system which is required to be maintained for an effective quality system. This set of practices was implemented by the International Standards Organization in Geneva for the purpose of assuring quality. Below are the objectives of ISO 9000 practices:
- Maintaining the quality of products according to requirements and reinforcing the improvement in organizational systems.
- To enhance the confidence among management and different stakeholders including customers for the quality parameters of the organization.
To achieve the goal of total quality management by putting higher efforts; ISO 9000 is considered a starting point. The intranet is beneficial for better communication as it provides different facilities such as data capturing and analysis, distributing the relevant data among users. It is easy to monitor and provide guidance. Through video-conferencing, there is no need to gather people at one place for any decision-making discussions.
Total Productive Maintenance (TPM)
This is considered a process through which the effectiveness of equipment can be maximized by the active participation of all supporting functions of an organization. The purpose of TPM is to enhance the overall productivity of the organization by optimizing the availability of equipment.
Maintenance plays a significant role in the production process. The concept of TPM is generated according to the need of integrating maintenance with manufacturing so that productivity can be improved. TPM is aimed at ensuring the all-time availability of equipment and machinery to produce goods and services. To measure the success of TPM, OEE i.e. “Overall Equipment Effectiveness” is used. Through OEE, organizations are able to monitor and benchmark their progress using simple and easily understandable metrics.
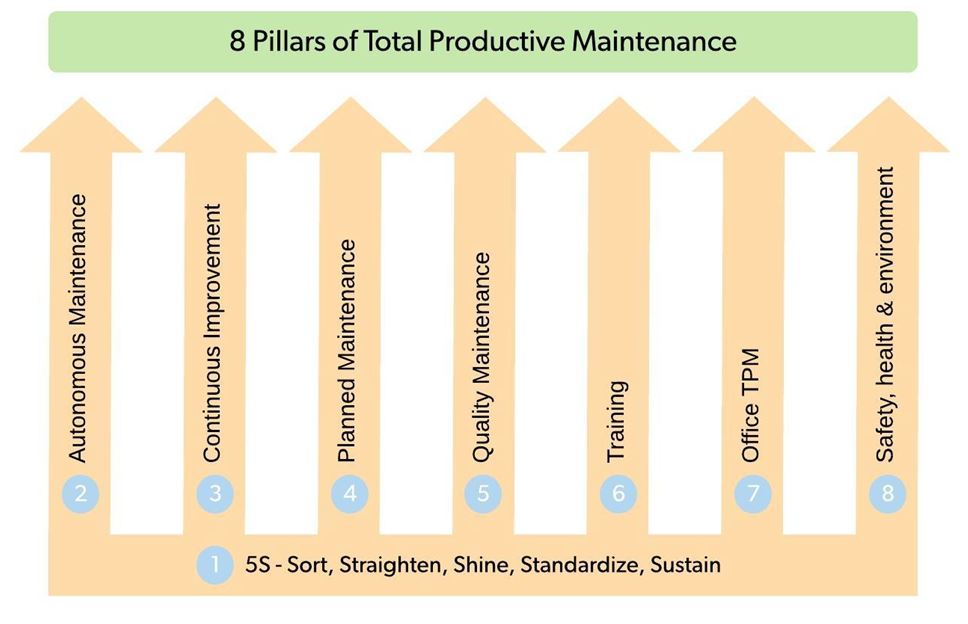
Pillars of Total Productive Maintenance
Below are the eight pillars of TPM: